ONS 2021 Census map reveals car ownership levels across Oxford
The Map released by the Office for National Statistics is a mine of information on all sorts of societal issues.

We’ve taken a quick look at car ownership levels in Oxford and Headington – see this ONS 2021 census map filter .
The map shows that 32.1% of households in Oxford have no car or van – so that’s nearly a third of households in Oxford that don’t own a car or van.
The table below sets out the car/van ownership levels across Headington and neighbouring areas at the “middle layer super output areas”, listing them in descending order starting with the areas with the highest percentage of car owners:
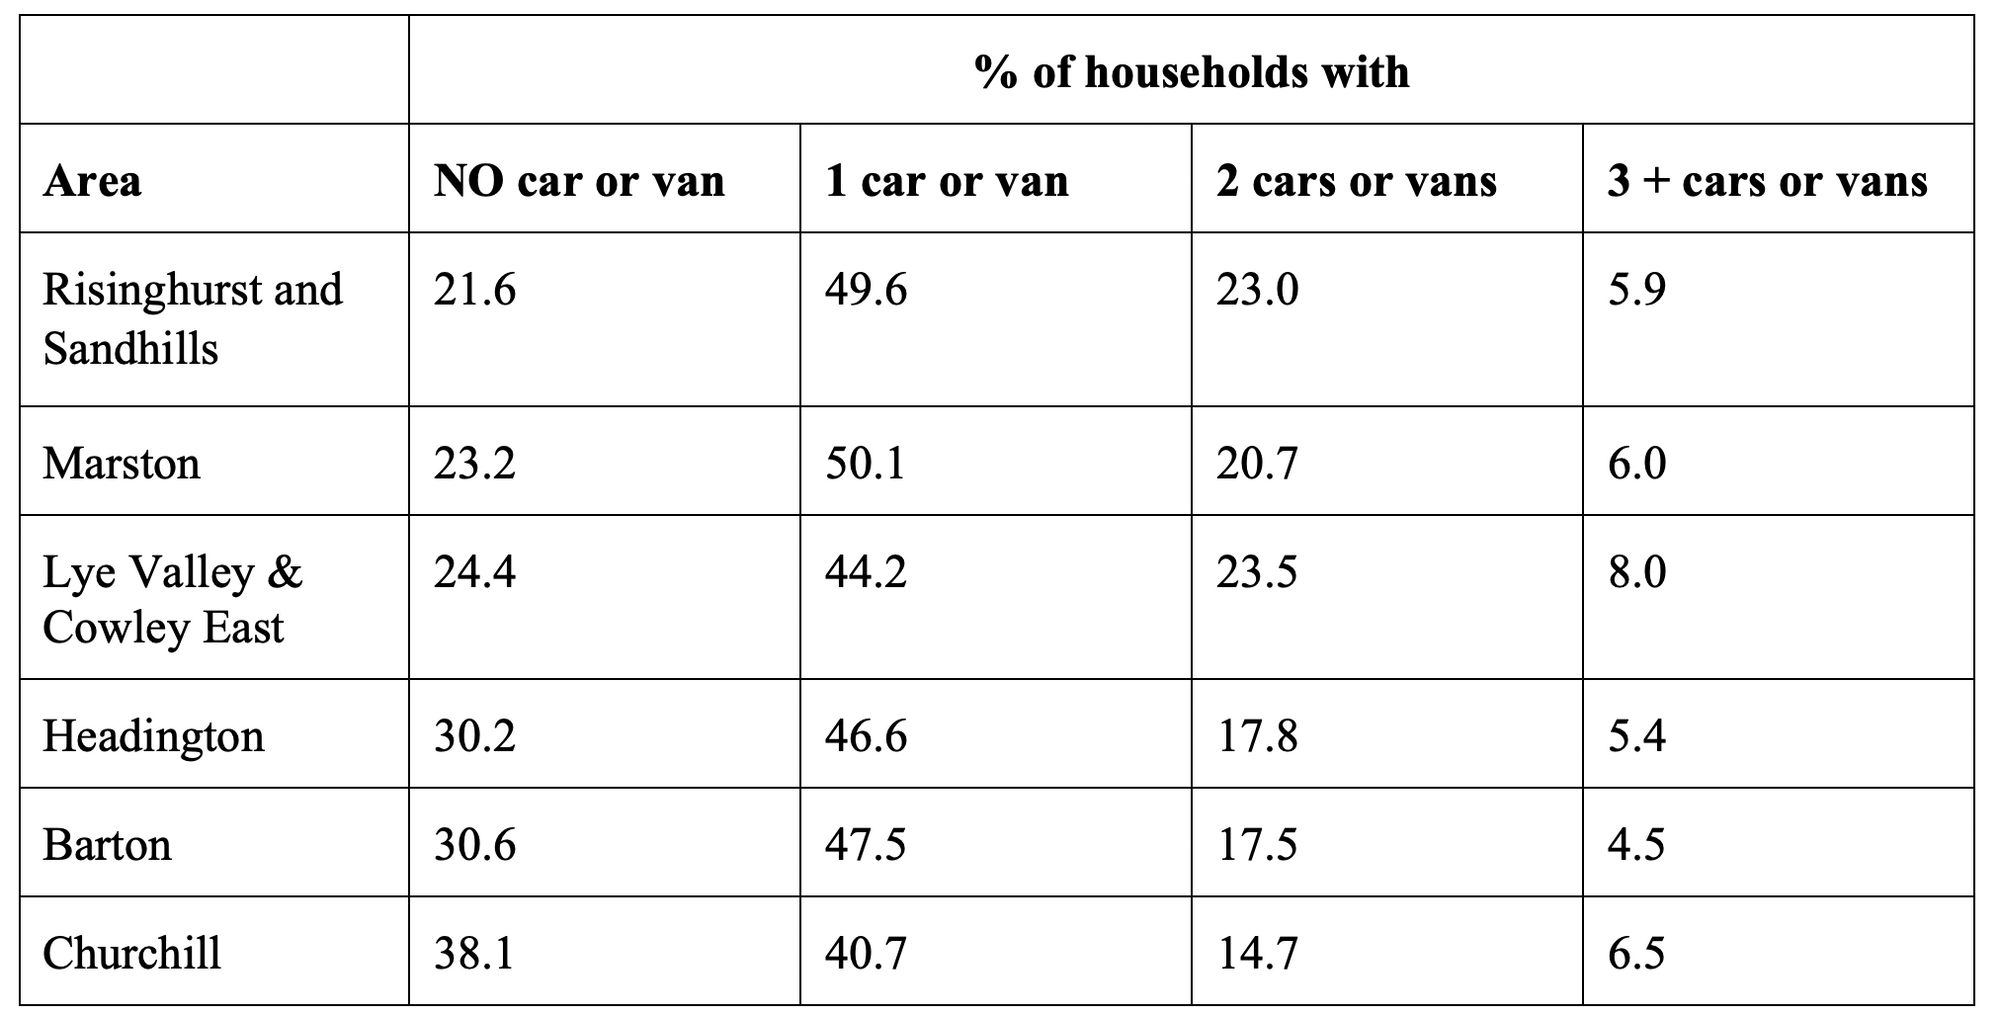
Whilst it’s difficult to establish trends and causes based on these figures and area boundaries, it does seem that the areas with higher car ownership levels tend to be areas that were deliberately built as low traffic (access-only) neighbourhoods, e.g.:
• Risinghurst and Sandhills: all of Sandhills and most of Risinghurst is low-traffic/access-only
• Marston: most of the roads off Marston Road and Oxford Road and in Northway and the Lakes are low traffic/access-only
• Lye Valley and Cowley East: most of Wood Farm and Lye Valley and all of the roads off Horspath Driftway and the East side of Hollow Way are low traffic/access only
Barton is an outlier, having relatively lower car ownership and also already being a low traffic neighbourhood (with the exception of the rat-runs created recently by the new Barton Fields Road).
This leaves Headington and Churchill, which have relatively lower car-ownership levels than surrounding areas, with higher levels of rat-running through minor residential roads that don’t have the protection of low-traffic/access-only road design that the areas with higher car ownership benefit from.
If we look at these figures at a more detailed level (known as “Output Areas” on the ONS map), focussing on some of the roads that currently suffer from high levels of through-traffic, quite a few of these have relatively low levels of car ownership:
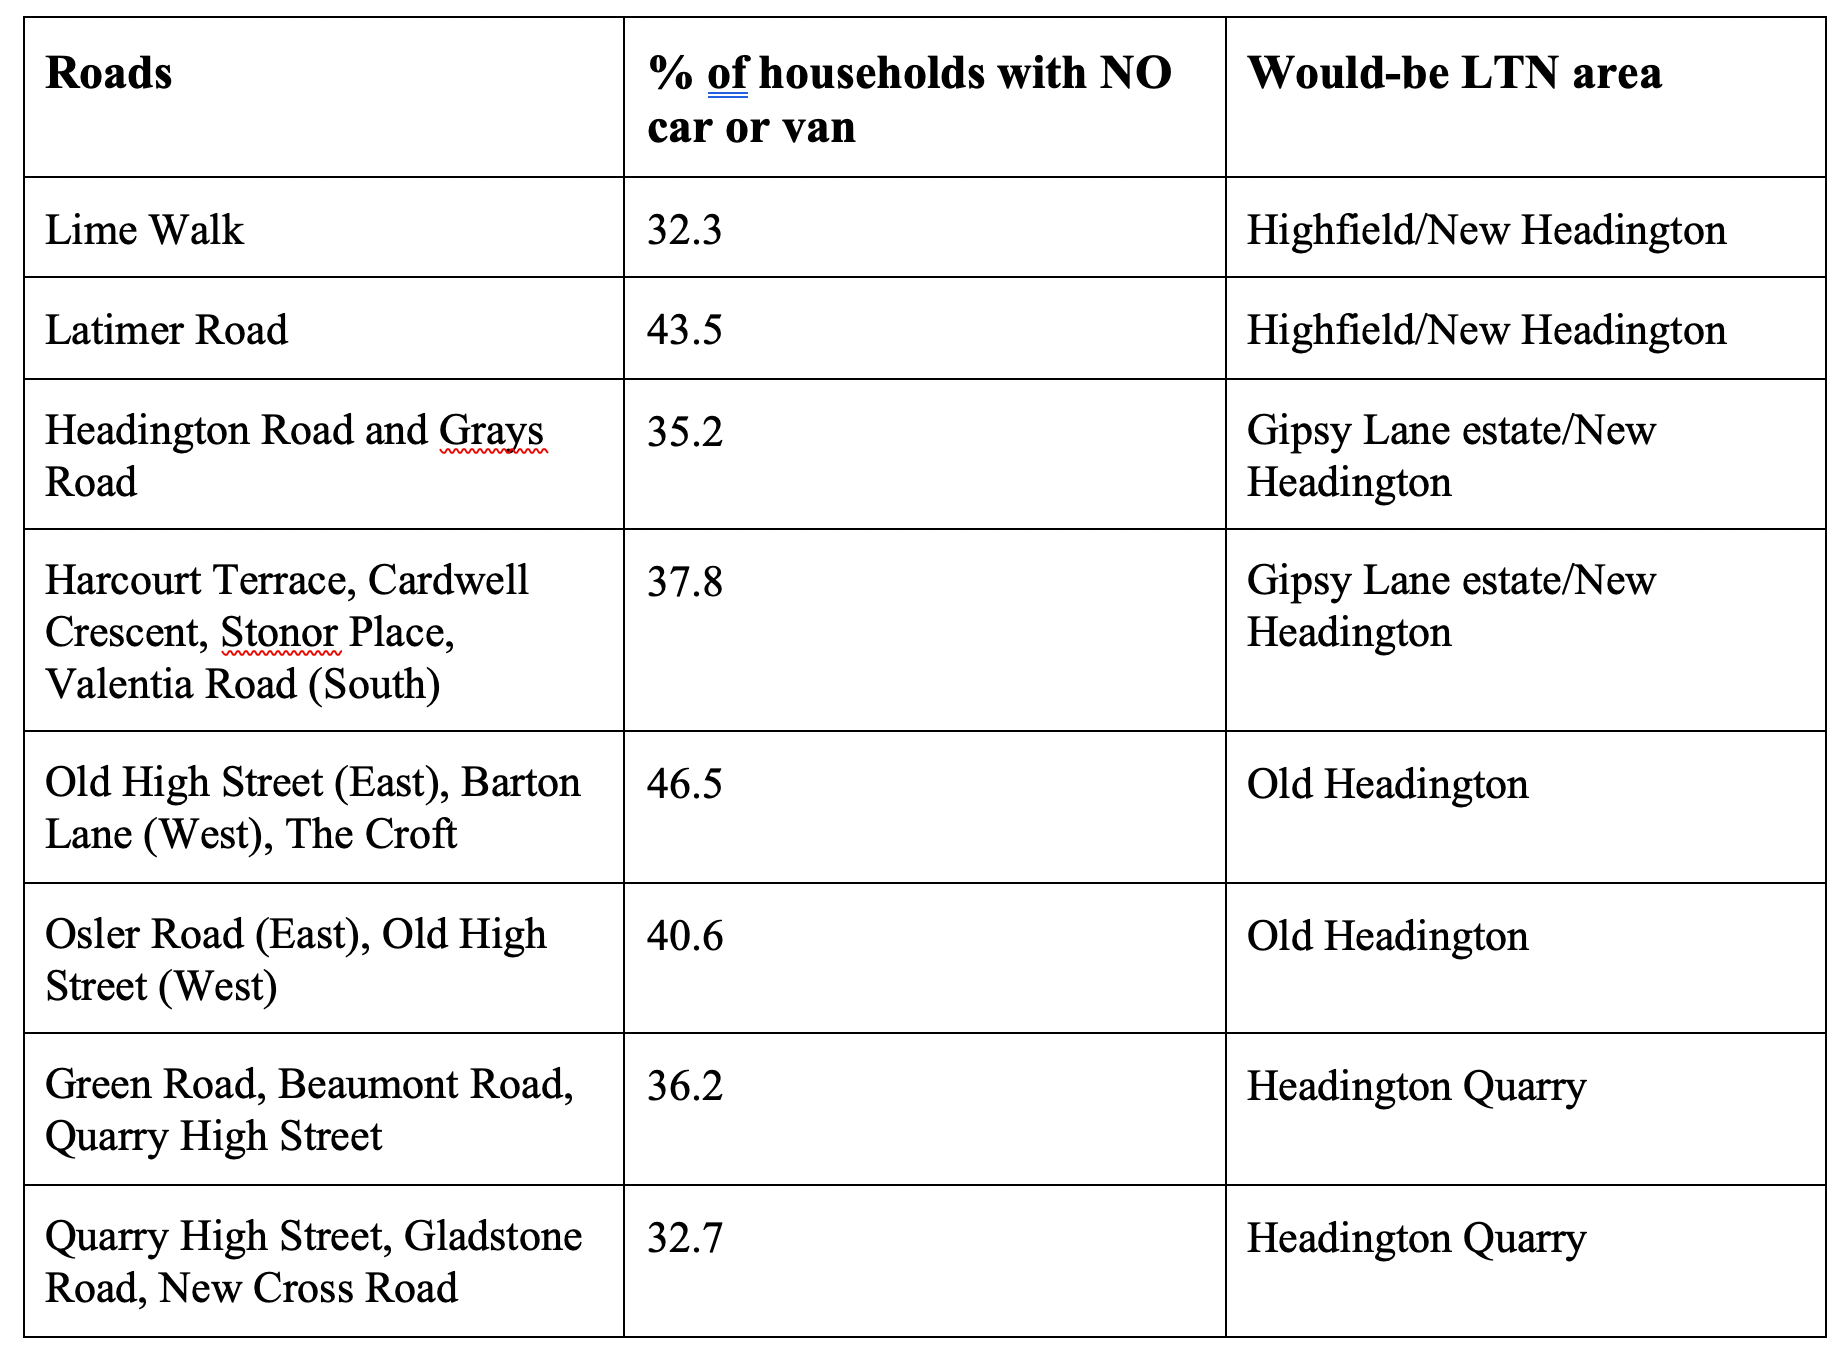
So, on many of the Headington roads most blighted with through-traffic, around a third or more residents have no car or van – meaning that the roads with some of the lowest levels of car ownership suffer some of the highest levels of through-traffic. Another interesting question is the correlation between income and car ownership. Tom Forth has analysed the ONS 2021 Census data on car/van ownership against ONS estimates of average income in each area (see Twitter thread here) .
The comparisons reveal that across England and Wales as a whole there’s a strong correlation between income and car ownership (the more money people have the more cars they buy):
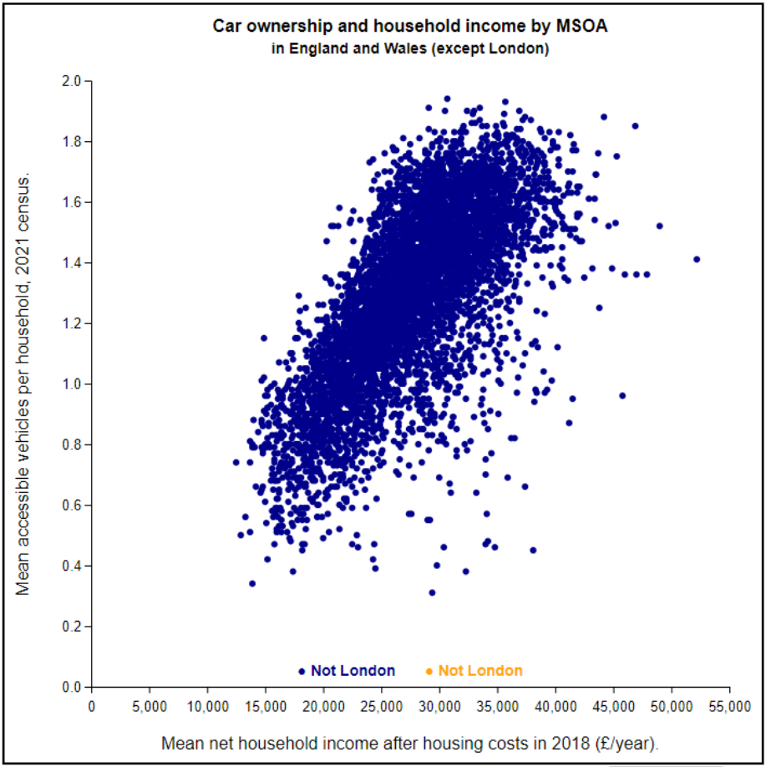
Yet in Oxford and Cambridge, “the relationship has nearly gone. There's no longer much correlation left.”:
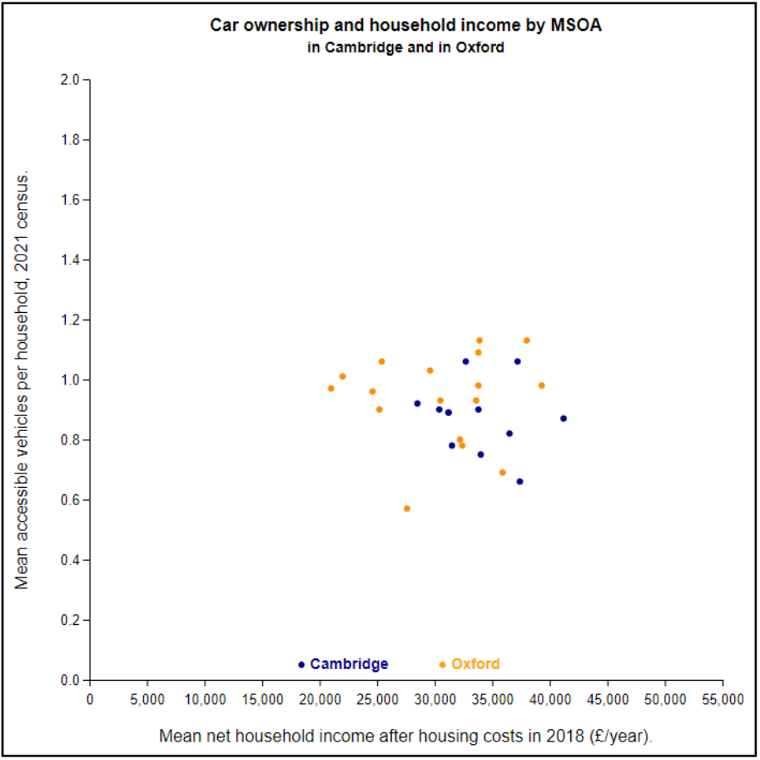
So, interestingly, there doesn’t seem to be a correlation between income and car ownership in Oxford, unlike most other parts of the UK.
This lack of correlation seems evident in the Headington area if you look at the household deprivation – household is deprived in one dimension map filter.
There are undoubtedly many contributing factors explaining this rare lack of correlation between income and car ownership in Oxford and Headington, which we won’t attempt to cover in this post!